A data analyst cleans business data, finds patterns and presents them as reports and dashboards that help managers decide. This roadmap covers Excel from basic to advanced, Access databases, Power BI dashboards and Python for analysis.
Learn formulas, functions, tables, sorting, filtering, charts and formatting so you can clean data and prepare accurate reports without doing calculations by hand.
Use lookup functions, pivot tables, conditional formatting, data validation, what-if analysis and macros to summarise large sheets and automate routine reports.
Learn tables, primary keys, relationships, queries and forms. These are the same ideas used in SQL databases, which most companies store their data in.
Import data from Excel and databases, clean it with Power Query, build a data model, write basic DAX measures and design dashboards that managers can filter and share.
Learn core Python, then use it to read, clean, combine and summarise data files and to automate repetitive reports. Libraries such as pandas and Matplotlib are practised on sample datasets.
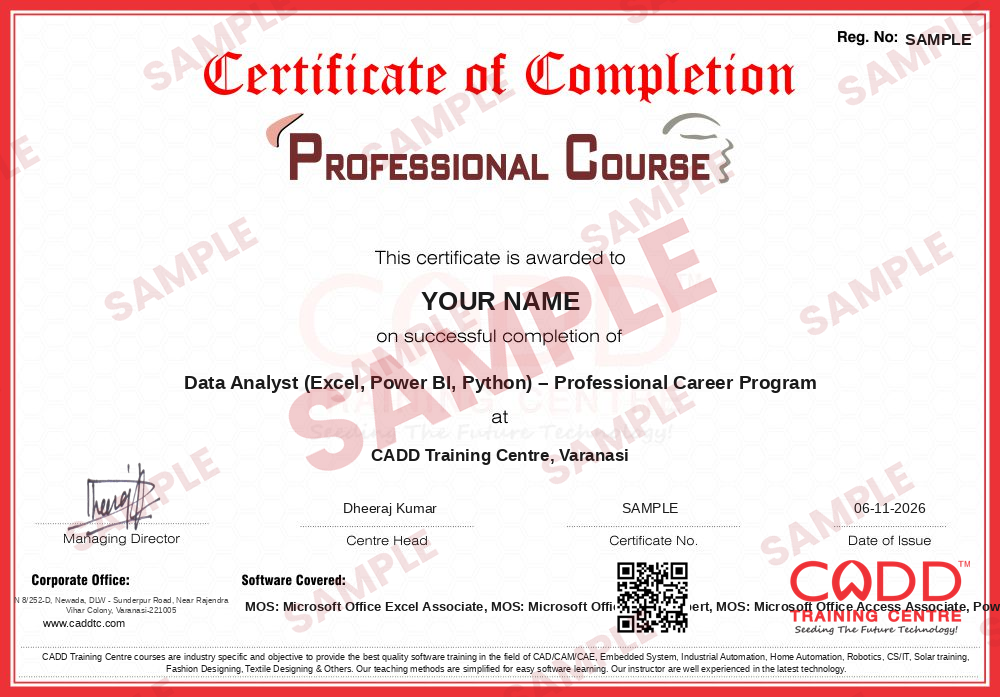
Finish the program and its project — you get the course-completion certificate and a digital completion badge with your name.
Take the certification exam: a theory test on the software of the program and a practical task of the job — at the centre or online.
Pass the exam and get the certified certificate with your marksheet. Anyone can check it online with its QR code.
Your certified badge — add it to LinkedIn and share it anywhere; it opens its own verify page.
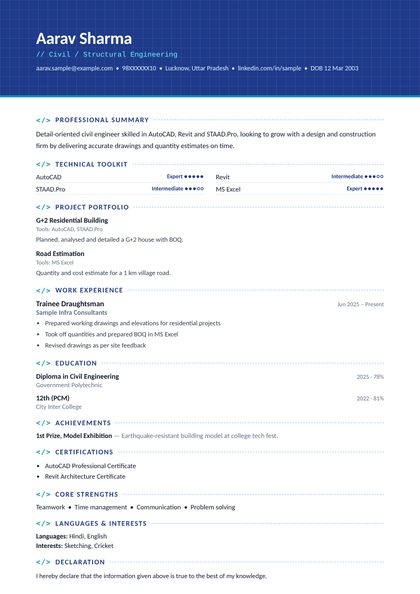
Make your CV in your student panel (Career → My CV) — your program, certificates and projects are added for you. Send it as a link with a preview picture, apply to jobs and answer Hire Me requests from companies.
The counsellor can shorten or extend this plan for your qualification and the time you have. Ask for your personal plan →
Join at the level that suits you — each level is a complete course you can enrol in.
Entry job — the first steps of the roadmap
The whole roadmap — every software of the job
A data analyst collects data from sales, accounts, operations or customer systems, cleans and combines it, and turns it into answers. A normal day can include fixing messy spreadsheets, writing formulas and queries, building pivot reports, creating dashboards that show sales, stock or collections at a glance, and explaining to a manager why a number went up or down.
Data analysts work in IT and analytics service companies, banks, NBFCs and insurance firms, e-commerce and retail chains, manufacturing and logistics companies, hospitals, and in MIS teams of almost every large organisation. Many work in back-office and shared service centres that prepare reports for clients in India and abroad.
Every business now records far more data than people can read line by line, and managers want clear numbers quickly. That is why companies look for people who can handle Excel with confidence, understand how databases are organised, build Power BI dashboards and use Python when data becomes too large or repetitive for spreadsheets. Strong Excel skills are often the entry point, and the other tools build on them.
Start with Excel and keep practising on real data such as sales or marks lists, then learn database basics, Power BI and Python. Complete a graduation alongside, because many companies ask for one, and build a few dashboard projects to show in interviews.
Strong Excel is enough for many MIS and junior analyst roles. For analyst positions in larger companies you usually also need Power BI or a similar dashboard tool, SQL and some Python.
Microsoft Office Specialist (MOS) Excel Associate and Expert prove your spreadsheet skills, and Microsoft PL-300 (Power BI Data Analyst Associate) is a recognised certification for Power BI. Certifications support your profile, but employers also look at your projects.
You can start with Excel and Power BI without coding. As data grows larger and reports become repetitive, Python and SQL make the work faster, so most analysts learn them within their first year or two.
Each step above shows its own course duration. Most students complete this roadmap in four to six months with regular classes, plus extra time to build two or three portfolio dashboards.
Yes. CADD Training Centre runs live online classes as well as classroom batches. You need a Windows computer with Excel and Power BI Desktop installed and should practise on sample datasets between classes.
More questions? Ask our counsellor or see all career roadmaps.
 Project Planning Engineer (Primavera / MS Project)A project planning engineer builds and tracks the schedule that keeps a construction or engineering project on time. This roadmap covers Excel, reading drawings, MS Project, Primavera P6 basics and advanced, and 4D planning.
 Embedded Systems EngineerAn embedded systems engineer programs the microcontrollers inside electronic products. This roadmap takes you from C and C++ through Arduino hardware, Proteus simulation and Python to entry-level firmware work.
 Python DeveloperA Python developer writes code for web apps, automation scripts and data tools. This roadmap takes you from core Python through web basics, spreadsheets and databases, and cloud concepts towards entry-level developer work.
 Web DeveloperA web developer builds and maintains websites and web applications. This roadmap covers HTML, CSS, web graphics, server-side Python and hosting basics so you can create and publish complete sites.
 Java DeveloperA Java developer builds enterprise software, web back ends and Android apps in Java. This roadmap moves from programming logic in C to Core Java, HTML and CSS, Advanced Java and cloud concepts.
 Accountant (Tally & GST)An accountant records business transactions, manages GST and prepares reports for owners and auditors. This roadmap covers Tally from basics to expert level, GST in Tally and Excel for MIS reports.